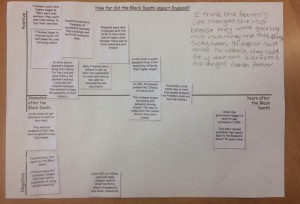
A “Living Graph” encourages students not only to select the most important events within a topic, but also to rate them (over time) against criteria such as success and failure, strength and weakness, significance and insignificance.
Stage 1: Brainstorm: Ask students, working individually or in pairs / small groups, to identify what they consider to be the 10 most significant events within the topic of study. For example, in a History class students could select the 10 most important events in a particular period; in English literature they could select the most important plot developments in a novel or play. The teacher asks students to contribute their ideas to a whole-class discussion. This will encourage some debate, discussion and reflection.
Stage 2: Depiction: Students then open the ClassTools Living Graph Template and plot their chosen events into it. They should aim not simply to describe “what happens” but “why it is significant”
Stage 3: Categorisation: Finally, the students have to drag and drop the events high or low on the graph to indicate something of relevance: success or failure, for example. Safety or Danger could be another idea.
Taking it further:
Students could use pipe cleaners instead of the ClassTools Living Graph Template, as per the pictured example by @LesleyMunro4.
Students could write an overall observation about change over time, as per this example by @MrThorntonTeach


